I will do an interactive plot of your geodata using Python Plotly API and Mapbox.
About:
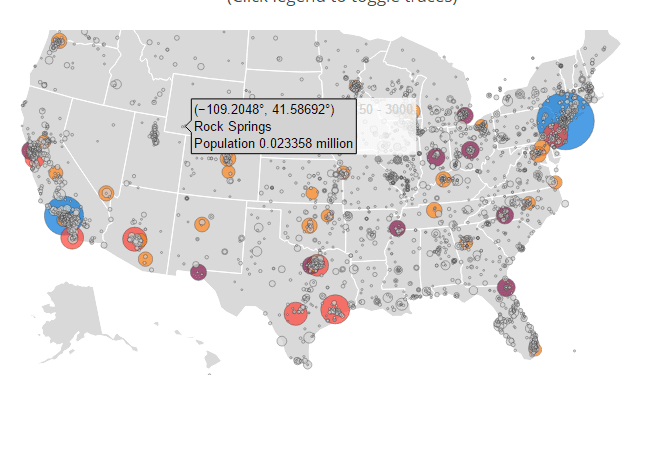
D3.js, Plotly, and Mapbox allow for the creation of excellent geographic data visualizations.Using Plotly and Mapbox, I will turn your spreadsheet data (up to 15000 rows) into a responsive map. Various types of maps can be created depending on your needs - including basic points, interactive hover features and dashboard visualizations. I am very flexible and put my effort into delivering a tailored, individual solution to my clients.
Data driven visualizations can also be complemented with filters and other control elements to steer the impact into explanatory or exploratory direction.
Upon completion, the map can be embedded in any website or shared privately or publicly. I can also provide the source file if you request it.
Please check out my Gig Extras. Feel free to ask any questions you may have, so we can discuss what you need done in more detail, and make sure you get the best results possible. I am very customer satisfaction oriented :)
Reviews
szergely:Kristian was very helpful, and helped me clarify what I wanted. He thinks with the client, and comes up with technological ideas I didn't think of. He speaks really good english, and understand the requests clearly, which is a huge benefit compared to the vendors I've worked with here. \nI would recommend working with him, I will too!
vybiralkristian:Great buyer, very understanding and easy to communicate with. Please do let me know if you need anything!
immersaglobal:Seller did a great job.
vybiralkristian:I would be glad to work with you again!
mayou379:Excellent work, very friendly and fast. Will definitely hire again!
No comments:
Post a Comment